How to Visualize Financial Resilience
Joe Rulison
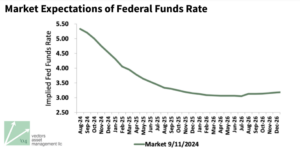
The graph below from Vectors Asset Management is a vital tool for building financial resilience through smart cash management.

At three+one, our cashVest platform harnesses liquidity data to keep you ahead of market shifts—and we’ve seen remarkable results firsthand. Here are just a few examples of how our clients have turned volatility into opportunity:
- In 2021, a Pennsylvania county partnered with cashVest to navigate the market upheavals of 2020, achieving operating cash returns 4x higher than benchmarks.
- A South Carolina city in 2021 outperformed the 30-day Treasury index by an impressive 4.87x.
- A New York school district exceeded market benchmark rates on its cash by 1.3x that same year.
- Amid the uncertainty of early 2020, a large New York county used cashVest’s liquidity forecast to secure cash earnings 5x the 30-day Treasury index.
These success stories prove financial resilience is within reach, even in volatile markets. Are you ready to unlock the full potential of your cash-management strategy?
Take action today.
Watch our 30-minute webinar, Maximizing Cash Management: Strategies for a Dynamic Rate Environment, and discover how to navigate market changes with confidence.
Many of you have already connected with your Relationship Specialist at three+one to explore how these market trends apply to your entity. If you haven’t done so yet, reach out to us today and start maximizing the value of your cash!


